How does shared context reach the engine?
These five questions distinguish the transfer route, shared attention, cold restoration, singleflight and advance preparation. Sharing one engine copy and reading the SSD once are separate properties.
11. Does DMA-BUF reduce offloaded-ancestor latency?
Yes for transport readiness and a single restored child in this workload. Measured on October 17, 2026, with an RTX 4090 and the DMA-BUF-enabled stack, DMA-BUF reduces median GPU-consumer readiness by 16.3% for a 48 MiB ancestor and single-child time to first token by 6.4%. The five-child burst has no stable latency benefit. All strict restoration and numerical gates pass with INFO logging.
| One 48 MiB ancestor restore | Host staging, p50 / p95 | GPU DMA-BUF, p50 / p95 |
|---|---|---|
| Adapter load complete | 8.063 / 8.204 ms | 8.023 / 8.160 ms |
| GPU consumer ready | 11.006 / 11.165 ms | 9.211 / 9.364 ms |
In everyday terms: the 48 MiB ancestor is a saved bundle of model state for the shared context. Restoring that bundle and completing a small GPU operation that reads it takes 9.211 ms with DMA-BUF versus 11.006 ms with host staging: about 1.8 ms less on this measured path, or 16.3%. This table measures one bundle being restored and consumed, not five children generating answers. The median (p50) is the middle run; p95 is the time at or below which 95% of the measured runs finish.
Four pairs alternate staged/direct order, with 100 measured restores per
arm in each pair, giving 400 measured restores per arm. Five warmups per cell
are excluded from timing summaries. Complete payload checks pass, and both
deliberately corrupted payloads are rejected. The native
submission/completion journal proves dmabuf_fixed versus
host_fixed, with complete bytes and drained ownership.
The adapter submits all sixteen chunks, waits for completion, then copies them into a GPU consumer that reduces every byte. The first timer ends at adapter completion; the second ends at the GPU consumer fence. Full byte comparison and SHA256 run outside timing. Destinations are poisoned before every restore. SSD ranges and registered mappings are warm. These measurements describe complete transfer paths; physical NVMe command splitting was not matched or traced.
What the model checks establish
The integration uses the production LMCacheMPConnector.
One arm restores an owned NVMe file into registered host memory and copies
to the engine. The other restores into a registered GPU DMA-BUF arena, then
copies KV into the engine cache. Both test cold external-cache restoration.
The resident prefix-sharing control and the CPU-backed shifted-span recovery
control isolate different mechanisms.
The serving comparison uses batch-invariant kernels, INFO logging and four alternating pairs, with 20 measured families per fanout and arm in each pair. Every one of its 1,152 continuation observations, including smoke checks and warmups, restores the full 4,096-token ancestor, matches generated tokens and has zero chosen-token log-probability difference from recomputation. Model-KV digests, native routes, complete payloads and drained ownership also pass.
How long does a child wait for its first output?
Time to first token (TTFT) is the wait from submitting a request until its first generated token. One child waits 23.403 ms with DMA-BUF versus 25.015 ms with staging: about 1.6 ms saved, or 6.4%. TTFT also includes serving work, so the transfer-path improvement does not translate directly into the same percentage improvement for the whole request. The second row submits five follow-up requests together and measures each child's wait. It is a separate workload, not five copies of the single-child timing added together.
| Time to first token | Host staging, p50 / p95 | GPU DMA-BUF, p50 / p95 |
|---|---|---|
| One child, 80 measured requests per arm | 25.015 / 26.105 ms | 23.403 / 24.412 ms |
| Five-child burst, 400 measured requests per arm | 55.183 / 75.137 ms | 54.912 / 75.257 ms |
Single-child median latency favors DMA-BUF in all four paired rounds. Five-child paired changes vary in sign; the pooled median changes by only 0.5%, while median batch completion is 74.576 ms direct versus 73.883 ms staged. These measurements do not establish a stable burst benefit. The serving result record retains all percentiles, paired medians, counts and limits.
Every retained five-child burst issues 80 backend chunk reads, totaling 240 MiB for a 48 MiB ancestor, in both transfer paths. A single child reads sixteen chunks, or 48 MiB. These counts motivate the cold-burst and load-coalescing experiments below. They count adapter requests and completed payload bytes, not physical NVMe commands, and do not prove how many ancestor copies occupy GPU memory simultaneously.
Reproduce the transport and serving comparison
The source inputs are the current vLLM serving branch and LMCache restore-validation branch. The latter extends the checksum endpoint to the current packed KV layouts. The restore README gives native preparation, exact pins, queued execution and CPU rechecks.
make defconfig-kmesh-restore-cuda
make kmesh-restore-plan

# Set source, model and NVMe output paths in menuconfig or the environment.
make kmesh-restore KMESH_RESTORE_PY=/path/to/prepared/python

KMESH_RESTORE_OUTPUT=/path/to/results make kmesh-restore-verify
The default preset selects the qualified adapter comparison and the
experimental Vulkan/RM GPU provider. KMESH_RESTORE_SECTION=all
also runs the strict serving qualification used for these timings. Keep
both component log levels at INFO for the timing comparison. Run on a host with the
qualified experimental DMA-BUF kernel and storage route;
a stock RunPod container does not provide that host integration.
The model is Qwen2.5-0.5B-Instruct at the baseline's pinned revision,
BF16 with a 4,096-token ancestor and five distinct 512-token tails. Two K/V
components × 24 layers × 256 tokens × two KV heads ×
64 values × two bytes make each 3 MiB chunk; sixteen make 48 MiB.
Both arms configure 256 MiB L1 capacity, a 512 MiB engine KV pool, 4 MiB slots,
ordinary file O_DIRECT, io_uring depth eight and one load/store
worker. Equal configured capacity does not mean equal total process memory.
Runtime: Python 3.13.15, PyTorch 2.13.0+cu130, vLLM
0.30.1rc1.dev624+g84bcbc626, NVIDIA 615.71.09, CUDA compiler
13.4.92 and the experimental 7.3.0-rc3-dmabuf-mapfence-20261008
kernel. There are two OpenMP/MKL threads, without a CPU-affinity cap.
Model startup and checksum controls are outside timed intervals.
The later registered shifted-state comparison tests a separate workload: four partial shared segments, real model repair and an external cache process. DMA-BUF read-call medians improve in all seven pairs, while complete restoration remains mixed. That study reports the integrity-check copies and forced cold-read controls explicitly; its timings are not another exact-prefix serving comparison.
12. Does cascade reach the shared-prefix attention path?
Yes, with the cascade-capable runner and flag selected explicitly. The October 17 RTX 4090 experiment uses the current vLLM serving branch with Llama-3.1-8B-Instruct, an 8,192-token shared ancestor, 32 distinct 512-token tails and 128 greedy generated tokens per child. Automatic prefix caching shares capacity; cascade groups attention reads of that ancestor and merges each child's private suffix. This test uses GPU-resident KV only. It does not use LMCache or measure storage restoration.
| Cascade policy | Observed layer-kernel calls | Median warm generation wall time | Changed continuations versus disabled |
|---|---|---|---|
| Disabled | 0 | 4,835.837 ms | 0 / 96 |
| Enabled, natural heuristic | 4,096 | 3,972.896 ms | 24 / 96 |
| Enabled, forced heuristic | 4,096 | 3,974.941 ms | 27 / 96 |
The untimed engagement control observes an 8,192-token common prefix on all 128 runner steps: 128 steps × 32 layers gives 4,096 kernel calls. Every natural heuristic verdict is true, so forcing engagement adds nothing at this shape. The disabled control makes no cascade calls. Each timed request reuses 8,688 prompt tokens, including the complete ancestor.
The natural path's median generation wall time is 17.8% lower in these three repetitions. Each policy has one fresh engine process, run in fixed disabled/enabled/forced order. This is exploratory evidence, without independent alternating process pairs. Timing includes cached-prefill scheduling and all 128 decode tokens, after removing the kernel-observation wrappers. It is not a measurement of attention bandwidth or decode-only latency.
Cascade changes floating-point evaluation order. The natural and forced arms change 24 and 27 of their 96 retained continuations relative to the disabled arm; each arm contains three repetitions of 32 children. This passes engagement checks, but does not establish numerical equivalence or task quality. Batch-invariant arithmetic is disabled because current vLLM disables cascade under that policy; the preceding restore comparison uses batch-invariant arithmetic and remains a separate result.
The reproducible profile explicitly selects the V1 runner and
FlashAttention 2, BF16, eager execution, synchronous scheduling, 32 maximum
sequences, 4,096 maximum batched tokens and a 4 GiB KV pool. Runtime is
Python 3.13.15, PyTorch 2.13.0+cu130, CUDA 13.0 and vLLM
0.30.1rc1.dev624+g84bcbc626, with two OpenMP/MKL threads and
no CPU-affinity cap. The Llama snapshot is
0e9e39f249a16976918f6564b8830bc894c89659. The
sanitized result retains
all samples, engagement counters and source/model/native hashes.
Reproduce the cascade controls
make defconfig-kmesh-cascade-cuda
make kmesh-cascade-plan

# Set model and source paths in menuconfig or the environment.
make kmesh-cascade KMESH_CASCADE_PY=/path/to/prepared/python

KMESH_CASCADE_OUTPUT=/path/to/results make kmesh-cascade-verify
The cascade README describes the authenticated inputs, process-local policy, rejected comparisons and CPU recheck. This tests an existing vLLM feature, with no family-aware scheduler or new attention kernel. The following section tests a cold external-cache burst versus a leader completed before its followers.
13. Do cold siblings repeat storage reads and GPU copies?
Repeated NVMe payload reads remain; GPU-copy amplification varies. The October 17 experiment releases siblings together from an empty engine cache, with their 48 MiB ancestor available only through the NVMe-backed external cache. A separate control completes the leader before submitting three followers. Each case retains three families after three warmups, on both host-staged and GPU DMA-BUF paths.
| Arrival case | Path | Backend ancestor reads per family | Observed live ready ancestor copies | Requests requiring external engine loads |
|---|---|---|---|---|
| Two-child burst | Both | 32 chunks / 96 MiB | 1 | 1 |
| Four-child burst | Both | 64 chunks / 192 MiB | 1 | 1 |
| Eight-child burst | Host staged | 128 chunks / 384 MiB | 1 | 1 |
| Eight-child burst | GPU DMA-BUF | 128 chunks / 384 MiB | 1–3 | 1–3 |
| Leader, then three followers | Both | 64 chunks / 192 MiB | 1 | 1 |
Every retained family reads the ancestor once per child at the backend, even in the leader-first control. Yet that control has one external engine load: its three followers report a 4,096-token local prefix hit and require zero new external tokens. Live block tables confirm one shared ancestor. Most burst families also share one copy; one of the three retained eight-child DMA-BUF families uses three copies, with five followers reusing local pages. The remaining two use one copy and seven local followers.
This separates storage work from engine-page sharing. In the pinned connector lookup path, ordinary lookup is submitted before subtracting the engine's local hit. The server's lookup handler starts prefetch; the adapter requests a range starting at token zero. The optional eager-prefetch flag is already off. Turning that flag off is therefore not a fix for this observed repetition. The next optimization must address lookup-triggered storage reads and the residual admission race separately, rather than assuming that every backend read creates a private GPU ancestor.
All 216 checked continuations, including warmups, have the full 4,096-token cached ancestor and exactly match recomputation's eight generated tokens. All 1,728 chosen-token log probabilities also match exactly. Restored model-KV digests, registered native routes, complete bytes and drained ownership pass. This table uses eight-token continuations and lookup observations. Request lifetimes and instrumentation can both affect admission timing; these samples do not establish a general race frequency.
Allocation/free observations retain live block IDs, request status and computed-token counts. Each ancestor spans 256 engine blocks. A reserved destination waiting for remote KV is counted separately from a running or completed request with a ready ancestor. These observations do not measure HBM bandwidth; backend chunk reads do not count physical NVMe commands. No latency result is claimed for this instrumented test.
The model, exact source pins, batch-invariant arithmetic, runtime and ordinary-file NVMe route match the restore comparison above. This profile uses seed 20260805, distinct 512-token tails, eight greedy output tokens, 512 MiB server arenas in each path and a 512 MiB engine KV pool. Both caches are cleared before each family; the external index and SSD ranges remain warm. The sanitized evidence retains each family's backend counts, live destinations, local-hit/load counts and source/model/native hashes.
Twenty-family arrival sample
A larger sample on the same RTX 4090 and frozen sources retains 20 families per case, again after three warmups. It passes all strict gates: 828 continuations and 6,624 chosen-token log probabilities match recomputation exactly, including warmups. Every retained family still reads the ancestor once per child at the backend. The ready GPU-copy counts vary as follows; each histogram contains twenty retained families.
| Case | Host-staged ready ancestor copies | DMA-BUF ready ancestor copies |
|---|---|---|
| Two-child burst | 1 copy: 19; 2 copies: 1 | 1 copy: 20 |
| Four-child burst | 1 copy: 20 | 1 copy: 17; 2 copies: 2; 4 copies: 1 |
| Eight-child burst | 1 copy: 15; 2 copies: 5 | 1 copy: 14; 3 copies: 4; 4 copies: 2 |
| Leader, then three followers | 1 copy: 20 | 1 copy: 20 |
The leader-first control always shares one GPU ancestor while still reading 192 MiB at the backend for the 48 MiB ancestor. Concurrent bursts occasionally need additional engine loads, including four-copy cases in the direct path. These observations strengthen the separation between repeated storage reads and the remaining admission race. Each mode/arrival combination uses one engine; the families are not independent process-paired trials and do not establish a general race rate or a difference in race probability between paths. The twenty-family record preserves the histograms and unchanged source/model/native identities. No coalescing change or latency qualification is included.
Reproduce the arrival controls
make defconfig-kmesh-coldburst-cuda
make kmesh-restore-plan

# Set prepared runtime paths and explicit inputs as described in the README.
make kmesh-restore KMESH_RESTORE_PY=/path/to/prepared/python

KMESH_RESTORE_SECTION=coldburst KMESH_RESTORE_OUTPUT=/path/to/results \
  make kmesh-restore-verify
The arrival-control instructions describe the queued wrapper and independent CPU recheck. This control measures default loading without KMesh load coalescing. The next experiment enables that feature to test whether one loader eliminates duplicate GPU ancestors.
14. How do follow-ups share one engine restoration?
Imagine four follow-up requests about the same document. The model has already processed their shared context, and its saved computation (the KV cache) is on the SSD. In this test that shared state occupies 48 MiB. It must be restored to vLLM's GPU cache before the requests can reuse it.
The problem: if the requests arrive together, several can start restoring their own copy before any one copy is ready to share. They need the same state, but the loading process has not coordinated them. That can waste GPU cache space and duplicate restoration work.
KMesh adds coordination:
- Choose one request to load the shared state. This is the loader, also called the leader.
- Make matching requests wait for that load. They wait before allocating their own destination in vLLM's GPU cache.
- Let them reuse the completed copy. vLLM's existing prefix cache supplies the sharing. Each request still gets private space for its different continuation.
This is called singleflight: one operation runs while other callers needing the same result wait for it. KMesh applies this established pattern in the LMCache connector. On this page, a GPU ancestor means the shared context's KV blocks in vLLM's GPU cache; it is not another model, GPU or agent.
What happened when we enabled it?
With coordination enabled, every tested family used one restoration into vLLM and one ready copy of the shared state in its cache. Without it, some simultaneous arrivals produced multiple ready copies. Each row below covers twenty measured groups of requests on each transfer path, after three warmup groups. A range such as 1–6 means the number of copies varied between groups.
| How follow-ups arrive | Copies in vLLM without coordination | Copies in vLLM with singleflight | Bytes read from storage, with or without |
|---|---|---|---|
| 2 follow-ups together | 1 | 1 | 96 MiB |
| 4 follow-ups together | 1–2 | 1 | 192 MiB |
| 8 follow-ups together | 1–6 with host staging; 1–2 with DMA-BUF | 1 | 384 MiB |
| 1 request finishes, then 3 follow-ups | 1 | 1 | 192 MiB |
Read the four-request row this way: singleflight leaves one usable 48 MiB copy in vLLM's cache. But storage still supplies 192 MiB—four reads of the same 48 MiB state. The feature fixes duplicate copies inside the engine; this experiment does not fix repeated SSD reads.
Why are reads still repeated? The connector asks the external cache for the data before the singleflight gate decides which request will load it into vLLM. That lookup already starts storage prefetching. A request can therefore trigger an SSD read and later reuse an existing vLLM copy. Section 16 tests keeping the data in the external cache so those lookups no longer reread it from the SSD.
Correctness checks, implementation limits and reproduction commands
The feature is opt-in and restricted to compatible exact text prefixes. It uses vLLM's existing scheduler retry mechanism and prefix cache. Disabled and enabled controls use identical sources and native binaries on an RTX 4090. The registry records 29 actual follower joins, including warmups. Every enabled family has one external engine load and one ready ancestor spanning 256 blocks; all remaining children hit the local prefix cache. Registry state drains when the family completes.
Across both controls, all 1,656 continuations and 13,248 chosen-token log probabilities match recomputation exactly, including warmups. Every child has the full 4,096-token cached ancestor. Producer/restored KV checksums, native registered-buffer routes, complete byte receipts and drained ownership pass. The sanitized comparison retains every backend count, copy/load histograms, exact source/model/native hashes and numerical bounds. Each control/path/arrival uses one engine; these are not independent randomized process pairs or a general race-rate estimate. No serving-speed claim follows from this instrumented replay.
Reproduce the singleflight experiment
Use public LMCache branch
2026-10-17-feature-kmesh-external-singleflight
at 100442de5a49, with vLLM unchanged at
1b76bf9dd9d5.
make defconfig-kmesh-singleflight-cuda
make kmesh-restore-plan

# Configure the prepared interpreter and authenticated model/source paths.
make kmesh-restore KMESH_RESTORE_PY=/path/to/prepared/python

KMESH_RESTORE_SECTION=singleflight KMESH_RESTORE_OUTPUT=/path/to/results \
  make kmesh-restore-verify
The restore README describes the pinned inputs and strict checks.
Singleflight starts when follow-ups arrive. The next experiment asks whether we can start preparing their shared context before they arrive.
15. Can loading context early make follow-ups start sooner?
Suppose an application knows it will launch four follow-up requests after a tool finishes. All four will reuse the same context, whose saved model state is on the SSD. Could we load that state while the tool is still running, so the follow-ups spend less time waiting once they arrive? That is the idea tested here. The actual experiment uses controlled delays to represent this opportunity; it does not run a real tool workflow.
What an early declaration actually does
The application tells the connector, in effect: “These upcoming requests will reuse this exact context.” This advance notice is the family declaration. The shared cached context is called the ancestor. The declaration itself does not load data or reserve GPU memory.
The current prototype prepares the context with a small real model request:
- Declare the expected reuse. Identify the shared context and the expected number of follow-ups.
- Submit a warm-up request that generates one token. This is an ordinary model request used to get the shared state loaded through LMCache into vLLM. It still performs real model work.
- Release the follow-ups after a controlled delay. If the state is ready, they reuse it. If the warm request is still active and the state is not reusable, matching follow-ups wait.
The time between starting the warm request and releasing the follow-ups is the head start, called the fork gap in the experiment. The intended advantage is to move work into time the application already has before those requests arrive. Delaying useful requests just to manufacture that gap would not establish an overall speedup.
What the timing table means
Four follow-ups means four separate requests to the model. Call them A, B, C and D, in the order we submit them. They share the same 4,096-token context, but each adds 512 input tokens of its own. The benchmark submits them together as one group and asks each request to generate 8 output tokens. A token is a piece of text, sometimes only part of a word; eight tokens are not necessarily a complete answer. With eight follow-ups, the same experiment has requests A through H.
This section's table follows request A only: start its stopwatch when A is submitted; stop it when A produces its first output token. A means the first request submitted, even if another request produces output sooner. The diagram below shows that stopwatch. Section 16 adds a second stopwatch for the time until every request has produced all 8 output tokens.
On a small screen, scroll the diagram sideways to follow the timeline.
Every value below is request A's wait for its first output token, in milliseconds. Lower is better. A still has seven more tokens to generate after this timer stops; B, C and D have their own output to generate.
- Load on arrival: use singleflight, but start restoring only when the follow-ups arrive.
- Already ready: a comparison with the context fully warmed before the follow-ups are submitted.
- Start 0, 25 or 100 ms early: request that much head start for the warm-up request. Actual release times are recorded because engine execution can delay submission.
The head start is outside the displayed wait. For example, a 100 ms head start followed by a 34 ms request wait is not a 34 ms total workflow. Prefetch work, bytes read and unused preparations are recorded separately; this table measures the delay the follow-up sees after arrival.
Host staging brings data through CPU RAM on its way to the GPU. The DMA-BUF path restores into a registered GPU buffer before copying into vLLM's cache. Both paths run the same preparation experiment.
| Transfer path / follow-ups | Load on arrival | Already ready | Start 0 ms early | Start 25 ms early | Start 100 ms early |
|---|---|---|---|---|---|
| Host staged / 4 | 46.631 | 54.893 | 58.093 | 32.493 | 34.220 |
| Host staged / 8 | 48.592 | 34.118 | 85.430 | 57.333 | 49.814 |
| DMA-BUF / 4 | 31.611 | 45.872 | 53.601 | 33.004 | 32.165 |
| DMA-BUF / 8 | 40.851 | 40.565 | 76.435 | 45.818 | 41.324 |
Example: with four follow-ups and host staging, loading on arrival gives a 46.631 ms median wait. Giving the warm request a requested 100 ms head start reduces that wait to 34.220 ms. But with DMA-BUF and four follow-ups, the corresponding wait is 31.611 ms versus 32.165 ms—no improvement in this sample.
These are medians of five measured groups per case, after three warmups, on an RTX 4090 on October 17, 2026. Cases run in fixed order with one engine per transfer path and group size. The small sample and visible variation limit interpretation, including the sometimes slower “already ready” control. This is not a reliable ranking of the two transfer paths.
Timing plots, wasted work, correctness checks and reproduction commands
The replay uses vLLM's public engine loop and requests head starts of 0, 10, 25 and 100 ms. Every sample records the actual interval; children can arrive while the warm request is still running. The connector waits before LOOKUP while the warm request is active and the ancestor is not locally reusable. Completion, cancellation or expiry releases the wait. Reuse is credited only after allocation admits the child. vLLM's existing prefix cache creates the physical sharing. No unfinished-restore estimate is added to a measured warm-child time.
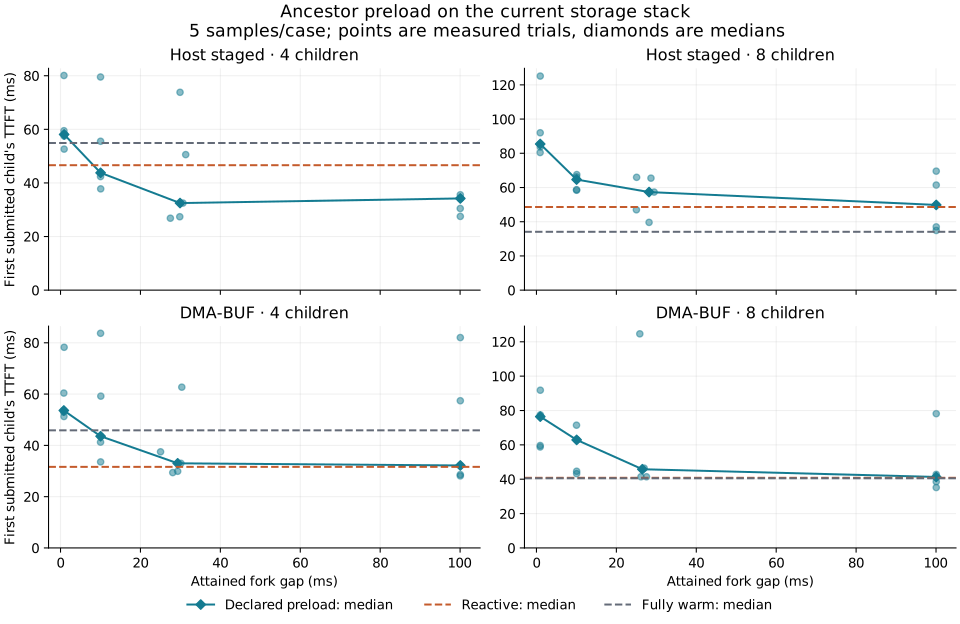
Storage work remains separate. Each full family, including its warm request when present, uses one complete external engine ancestor load. The backend can still read that ancestor for later LOOKUPs even after vLLM has it locally. The verified archived record retains every retained family's backend read count, local-hit/load counts and timing samples. Four unused-preload controls release no children: each incurs 16 native payload reads, 48 MiB, and one wasted declaration without a child hit. Preloading consumes real work; logical declaration bytes are not measured storage savings.
All 1,152 child and 164 warm continuations, including warmups and unused controls, match their references. All 9,380 chosen-token log probabilities match exactly, maximum delta 0.0. Every child reuses the full 4,096-token ancestor. The first warmup of each case also checks producer/restored model-KV digests and live ready ancestor ownership. Registered native routes, complete bytes and drained ownership pass for every family; no I/O evidence eviction is accepted. 412 children exercise pre-LOOKUP waiting. Immutable prefix identities are cached on the request tracker so repeated waiting polls do not copy and hash the prompt again.
This is a caller-driven Python-connector prototype with synthetic exact prefixes, distinct 512-token tails, eight greedy child tokens, batch-invariant arithmetic, a 512 MiB engine KV pool and a 512 MiB external arena. Each path/fanout uses a fresh storage owner and engine to keep audit history bounded. Retained timings have allocation observation hooks removed. The NVMe index stays warm and both resident caches are cleared before each family. The test has no eviction-pressure workload and does not qualify HBM retention leases, task quality or cross-engine sharing.
Reproduce actual fork-gap preloading
Use LMCache 44a52bda3b49
and vLLM 1b76bf9dd9d5, with the prepared model and native runtime
specified in the
restore README.
make defconfig-kmesh-family-prefetch-cuda
make kmesh-restore-plan

# Set model/source paths and the prepared interpreter as described in the README.
make kmesh-restore KMESH_RESTORE_PY=/path/to/prepared/python

KMESH_RESTORE_SECTION=family KMESH_RESTORE_OUTPUT=/path/to/results \
  make kmesh-restore-verify

python tools/reproduce/kmesh_restore/publish_family.py /path/to/results \
  --output public-results.json
python tools/reproduce/kmesh_restore/plot_family.py public-results.json \
  --output preload.svg
The following control uses LMCache's existing retained L2-to-L1 warm operation before the engine preload, asking whether external-L1 residency removes repeated NVMe reads. It counts HTTP work and extra residency separately from GPU sharing.
What happens after fixing the repeated SSD reads? Section 16 measures that follow-up: it retains the state in LMCache and times the requests again. Both controls there preload 250 ms early, so it tests retention's effect rather than repeating this on-demand-versus-prefetch head-start sweep. Section 20 completes that comparison with the read problem fixed in both approaches and finds a clear early-loading benefit.